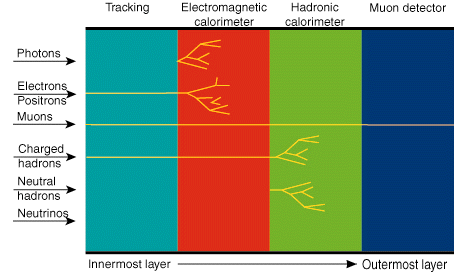
You will be analysing data recorded with the DELPHI detector. If you want to understand in detail how the DELPHI detector works, it might be a good idea to "visit it now". But the information below should give you enough information to move on to the projects right away. The picture below shows how different kinds of particle interact with different kinds of detector components. All charged particles leave tracks behind in the tracking chambers, while neutral particles do not. Photons, electrons and positrons lose all their energy in the electromagnetic calorimeter.
Particles containing quarks, collectively known as hadrons, lose their energy in the hadronic calorimeter. Muons leave tracks behind in the tracking chambers, lose a little energy in the calorimeters, and are also detected by the muon chambers, the outermost layer of the detector. Neutrinos do not interact with any of the detector components and escape unseen.

As a tool you will be using a program, WIRED, to visually scan and manipulate Z particle decays that were recorded by the DELPHI detector at LEP. WIRED is a computer program developed at CERN in the Java language that allows physicists to study computer reconstructions of collisions in 3-D.
This is what a typical event in WIRED looks like. Move the mouse over the WIRED buttons to find out what they do.
Below are examples of the different visible decays of the Z particle. One event of each type is an animation and the others are real events that you can study using WIRED. Have a look at each of them. WIRED allows you to zoom in on the event, to rotate it, and to switch on and off the outlines of the different subdetectors.
Switching on and off the subdetector outlines is a powerful tool for identifying particles. For example, you can tell whether an energy deposit is in the electromagnetic calorimeter or the hadron calorimeter. This allows you to identify the particle that made the deposit and will help you to classify the event. It's a good idea to view the outline of only one detector at a time because when several are shown at once the large number of overlapping lines makes it difficult to interpret the event. Bear in mind that the DELPHI detector looks like a barrel plugged at each end by an end-cap.